
Was this sample helpful? Rate it!
Average: 4.9 (11 votes)




Contents
Key Takeaways for an Analyst Resume
Why This Analyst Resume Works
How to Write an Analyst Resume
What to Include in an Analyst Resume
Analyst Resume Summary Examples
Analyst Work Experience Examples
Top Analyst Skills
Certifications for an Analyst
Analyst Salary
Common Analyst Resume Mistakes
Analyst Resume FAQs

Summary
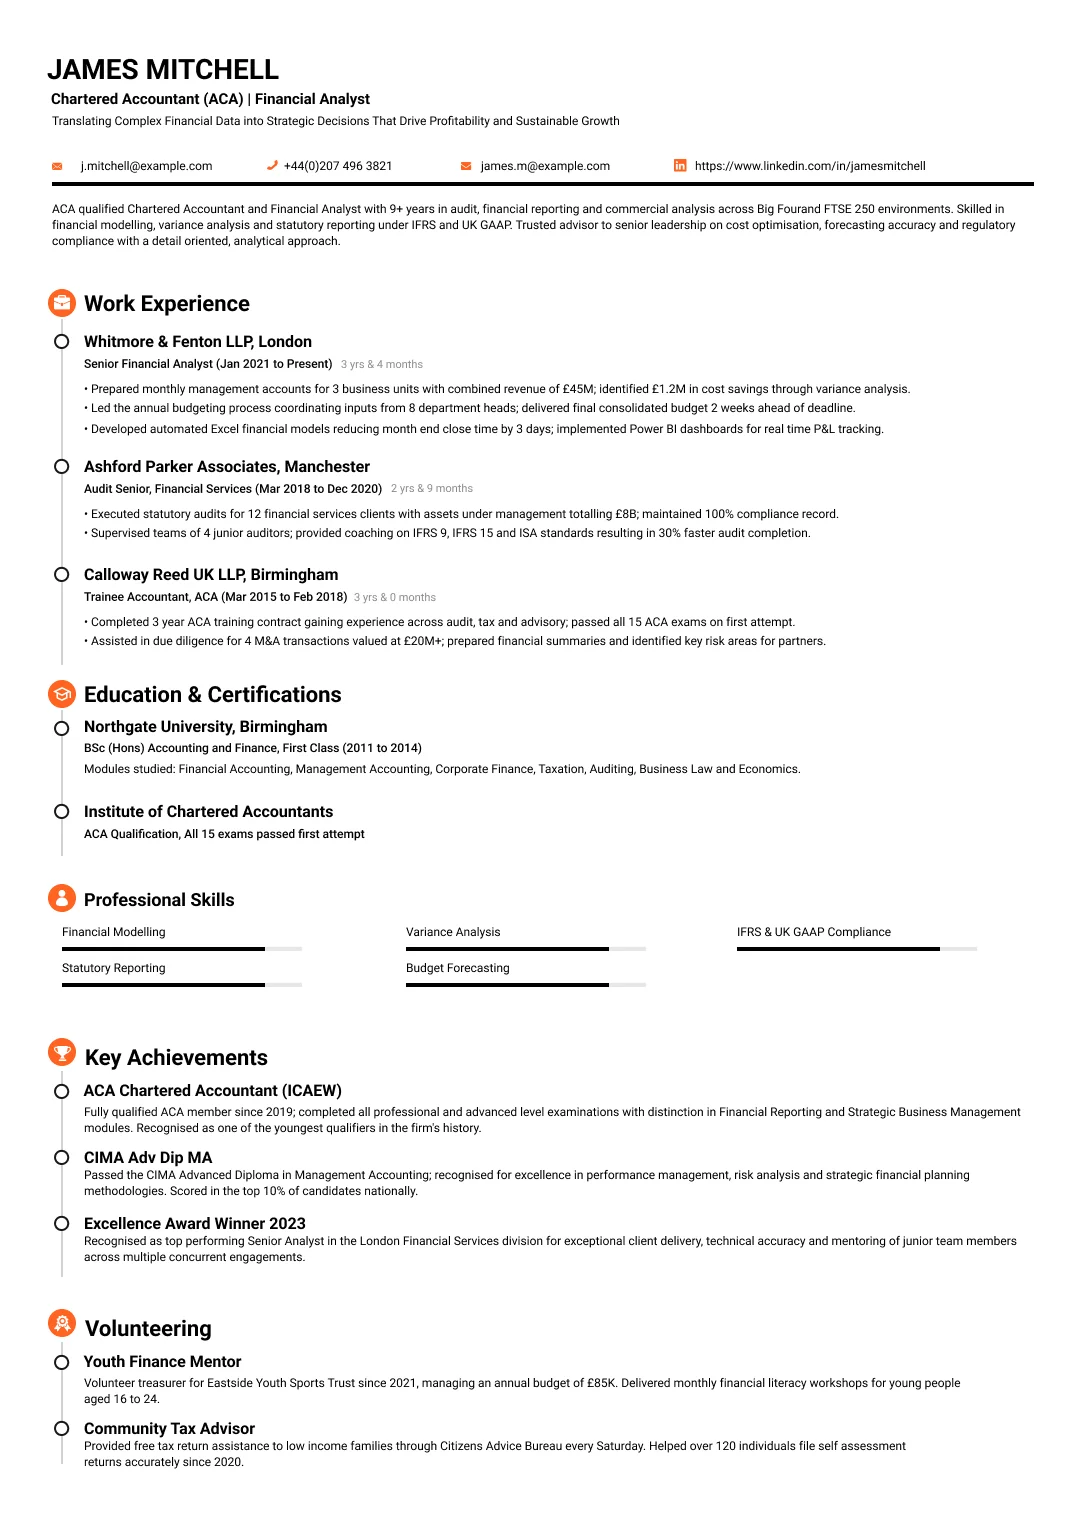
Analyst with seven years turning data into insight for commercial and operational teams at a company in Manchester. Pulls together data from across the business, analyses it, and gives managers the evidence behind their decisions. Built a reporting and dashboard suite that gave leadership a clear, real-time view of performance. Gathers and cleans data, builds reports and models, analyses trends and performance, and translates findings into clear recommendations people can act on. Strong on both the analytical rigour and the communication that makes analysis land, fluent in SQL, Excel and visualisation tools. Curious, careful and good at telling the story behind the numbers. Looking for an analyst, business-analyst or data-analyst role with an organisation that runs on evidence.
Work Experience
Analyst
Manchester Business Group, Manchester, UK
Apr 2017 – Present
- Turn data from across the business into insight that supports decisions.
- Built a reporting and dashboard suite that gave leadership a clear, real-time view of performance.
- Gather and clean data and build reports, models and analyses.
- Analyse trends and performance and identify issues and opportunities.
- Translate findings into clear recommendations managers can act on.
- Work in SQL, Excel and visualisation tools across analyses.
Junior Analyst
North West Data Services, Manchester, UK
Aug 2015 – Mar 2017
- Produced reports and analysis for commercial teams.
- Maintained data, dashboards and performance trackers for teams.
- Learned SQL, analytics and reporting on the job.
- Gained certification and a full analyst role.
Education
BSc (Hons) Economics & Statistics, Economics & Statistics
University of Manchester
Sep 2012 – Jun 2015
- Degree in economics and statistics covering data, modelling and analysis, with a placement year. The placement led directly into analysis. Built the analytical foundation the role requires.
Data Analytics & SQL Certification, Data Analytics
Microsoft
Jan 2017 – May 2017
- Certification in data analytics and SQL covering querying, modelling and dashboards. It sharpened the analytics toolkit used daily. Applied directly to reporting and analysis across the business.
Highlights
Real-time reporting suite
- Built a reporting and dashboard suite that gave leadership a clear, real-time view of performance. Seeing the business clearly at a glance helps leaders act sooner.
Story behind the numbers
- Turns raw data into a clear story managers can act on, not just charts. Analysis creates value only when someone changes a decision because of it.
Certifications
Data Analytics & SQL
Microsoft
May 2017 – Present
- Certification in data analytics and SQL covering querying, modelling and dashboards. It sharpened the analytics toolkit used daily. Applied directly to reporting and analysis across the business.
Power BI & Advanced Analytics
Power BI & Advanced Analytics
Microsoft
Jan 2018 – Apr 2018
- Completed an advanced Power BI and analytics course covering data modelling, dashboards and storytelling. It strengthened the visualisation and analysis skills used to turn data into clear recommendations.
Languages
- English (UK) — Native or Bilingual Proficiency
- French — Limited Working Proficiency
Technical Skills
- Data Analysis
- SQL
- Dashboards & Reporting
- Excel
- Data Visualisation
- Trend Analysis
- Modelling
- Data Cleaning
- Performance Analysis
- Recommendations
Personal Skills
- Analytical Thinking
- Curiosity
- Communication
- Attention to Detail
- Problem Solving
Activities & Interests
- Online Shop
- Smoking
- TV
- Play with Dog
- Holidays
Key Takeaways for an Analyst Resume
Analyst is a family of jobs, not one job. These are what separate a strong application from the pile:
- Say what kind of analyst you are and what domain you analyse, because business, data, financial and operations analysts are recruited separately.
- Lead with decisions changed rather than reports produced, since analysis that nobody acted on had no value to the business.
- Name your stack precisely, as SQL, Python, Power BI, Tableau and Excel are all screened as literal keywords before a person reads anything.
- State your SQL level honestly, because the gap between writing a SELECT and writing window functions over millions of rows is enormous.
- Show that you own data quality, since most analyst time goes on cleaning and reconciling rather than on the analysis itself.
- Evidence communication with a real example, because analysts are hired on whether non-technical people understood and acted on the work.
Why This Analyst Resume Works
This sample belongs to a seven-year analyst supporting commercial and operational teams, and it handles the ambiguity of the title sensibly.
- The opening names both the audience and the purpose, giving managers the evidence behind their decisions, which frames analysis as a service to decision-making.
- It leads with a built artefact rather than a task list, a reporting and dashboard suite that gave leadership a real-time view of performance.
- The full analytical cycle is covered from gathering and cleaning through modelling to recommendation, which shows someone who owns the work end to end.
- Data cleaning is stated explicitly rather than glossed over, and being honest about where analyst time actually goes reads as experience rather than naivety.
- The tooling is named specifically, SQL, Excel and visualisation tools, which is what an automated screen filters on before any human involvement.
- The closing line names three adjacent titles, analyst, business analyst and data analyst, which is a realistic response to how inconsistently these roles are advertised.
How to Write an Analyst Resume
The reader needs to know what you analyse, what changed because of it, and whether you can do the technical work unaided.
Declare your analyst type in the first line
Business, data, financial, operations, marketing, risk or product analyst. The bare word analyst forces a hiring manager to work out where you fit, and most will not bother when the next application states it plainly. Add the domain: retail operations, insurance claims, subscription revenue.
Write outcomes, not deliverables
Twelve dashboards built is a deliverable. Identifying that a delivery route was running at a loss and having it repriced is an outcome. Analysts are paid to change decisions, so lead with what somebody did differently because of your work rather than with what you produced.
Be exact and honest about SQL
Say what you actually write: joins across several tables, window functions, CTEs, query optimisation on large datasets. SQL is the single most tested analyst skill at interview, and vague claims collapse in about four minutes when someone hands you a live query problem.
Own the unglamorous half
Data cleaning, reconciliation between systems, definitions agreed across teams, and pipelines that stopped breaking. Most analyst work is making data trustworthy before anything can be concluded from it, and candidates who describe this read as far more experienced.
Show the communication landed
A recommendation adopted, a model a non-technical team now runs themselves, a report that replaced an argument with a decision. The failure mode of this job is correct analysis nobody acts on, so evidence that your work actually persuaded people is genuinely differentiating.
Give your analyses scale and cadence
Row counts, number of source systems reconciled, refresh frequency, and how many people use what you built. An analyst maintaining a weekly report for three people and one running a daily pipeline used across a business are doing very different jobs.
Analyst roles attract very high application volumes, so the resume has to survive a keyword screen before a human sees it. You can build a clean analyst resume free and keep the tools and outcomes where a screener will find them.
What to Include in an Analyst Resume
Beyond the standard sections, these are the elements that survive a technical screen:
Your analyst type and business domain, stated in the title line rather than left to be inferred from the bullets.
A technical stack block splitting query languages, programming, visualisation and any statistical tooling.
Two or three decisions that changed because of your analysis, each with the outcome attached.
Data scale, including row counts, number of source systems and the refresh cadence you maintained.
Stakeholders served, naming the functions and seniority you present to rather than only the tools you used.
Any modelling or forecasting work, with the method named and how accurate it turned out to be.
Extra tips
Write "identified two routes running below break-even, both restructured the next quarter" rather than "built route profitability dashboard".
Dashboards are output; a decision that changed is the only thing the business actually bought.
Analyst Resume Summary Examples
Two summaries at different levels, both naming the analyst type and leading with a decision that changed:
Entry-level resume summary example
Junior operations analyst with eighteen months supporting a logistics team, reporting on delivery performance, cost per drop and route utilisation across a fleet of sixty vehicles. Writes SQL daily including multi-table joins and window functions against a warehouse of roughly forty million delivery records, and rebuilt the weekly performance pack in Power BI to refresh automatically rather than being assembled by hand each Monday. Identified that two regional routes were running consistently below break-even once fuel and driver hours were properly allocated, which led directly to both being restructured the following quarter. Holds the Microsoft Power BI Data Analyst certification and works in Excel to an advanced level including Power Query. Looking for an operations or data analyst role with a business that acts on its reporting.
Senior-level resume summary example
Commercial analyst with eight years supporting pricing and trading decisions in retail, currently the analytical lead for a category turning over around ninety million a year. Built and owns the margin analysis model that reconciles data across three source systems covering sales, stock and supplier cost, replacing a manual process that previously took four days each month. Identified a pricing anomaly across a supplier range that had been eroding margin for several quarters, with the resulting repricing recovering an estimated one point two million annually. Presents weekly trading analysis to a commercial director and category managers, and has trained six non-technical colleagues to self-serve routine reporting. Fluent in SQL and Python, and looking for a senior or lead analyst role with genuine influence on commercial strategy.
Analyst Work Experience Examples
Three sets covering the common analyst tracks, since reporting, commercial analysis and process-focused work are assessed quite differently.
Reporting and business intelligence
- Rebuilt the weekly performance reporting pack in Power BI so that it refreshed automatically from the warehouse, replacing a manual assembly process that consumed most of every Monday.
- Wrote and maintained SQL across a warehouse of roughly forty million delivery records, using window functions and common table expressions to produce metrics that had not previously existed.
- Reconciled reporting definitions across three business functions that had been publishing conflicting figures, agreeing a single definition of each metric and documenting it for everyone.
- Reduced the monthly reporting cycle from four days of manual work down to an automated refresh with half a day of review, freeing the equivalent of a full week each month for real analysis.
- Trained six non-technical colleagues to self-serve their routine reporting through the dashboards, which cut ad hoc reporting requests coming into the analytics team by well over half.
Commercial and financial analysis
- Built and owned the margin analysis model reconciling sales, stock and supplier cost data across three separate source systems for a category turning over around ninety million a year.
- Identified a pricing anomaly across a supplier range that had been quietly eroding margin for several quarters, with the resulting repricing recovering an estimated one point two million annually.
- Produced the weekly trading analysis presented to a commercial director and six category managers, translating the numbers into two or three specific recommended actions each week.
- Modelled the financial impact of three proposed promotional mechanics ahead of launch, with the forecast on the option finally selected landing within four percent of the actual outcome.
- Investigated a persistent variance between the finance ledger and the trading system, tracing it to a currency conversion timing difference that had been misreported for over a year.
Operations and process analysis
- Analysed delivery performance, cost per drop and route utilisation across a fleet of sixty vehicles, building the business's first view of true profitability at individual route level.
- Identified two regional routes running consistently below break-even once fuel and driver hours were correctly allocated, leading directly to both being restructured the following quarter.
- Mapped an end-to-end order process across four systems to locate where orders were stalling, isolating a single manual approval step that accounted for most of the total delay observed.
- Built a forecasting model for weekly labour requirements using historical volume and seasonality, cutting reliance on agency cover by around a fifth across two consecutive quarters.
- Automated a daily data quality check that flagged missing and duplicated records before they reached reporting, preventing several recurring errors from being published to leadership.
Top Analyst Skills
What an analyst screen tests for, split between the technical work and the communication that decides whether it lands:
Hard skills
- SQL
- Data Analysis
- Excel (Advanced / Power Query)
- Power BI
- Tableau
- Data Cleaning & Preparation
- Dashboard Design
- Data Modelling
- Forecasting & Trend Analysis
- Python (pandas)
- Statistical Analysis
- Data Reconciliation
- KPI Definition & Tracking
- Requirements Gathering
- Process Mapping
- Report Automation
- Stakeholder Presentation
Soft skills:
- Analytical Thinking
- Curiosity
- Scepticism About Data
- Clear Explanation
- Attention to Detail
- Commercial Awareness
Certifications for an Analyst
None of these substitute for demonstrable work, but they help a career changer clear the first screen:
-
Microsoft Certified: Power BI Data Analyst Associate
— Microsoft The most directly useful certification for reporting and BI work, and Power BI appears by name on a large share of analyst job adverts.
-
ECBA
— International Institute of Business Analysis (IIBA) Worth holding if you are heading toward business analysis rather than data analysis, since it covers requirements and process work rather than tooling.
-
Google Data Analytics Professional Certificate
— Google A reasonable structured starting point for career changers with no analytical work history. Treat it as a foundation rather than as a qualification employers weight heavily.
Analyst Salary
Analyst pay varies more than almost any other title, since the word covers junior reporting roles and senior quantitative specialists alike:
USD 60,000 – USD 165,000 · Management analyst · US
National median around $101,860 for management analysts. Junior reporting analyst roles sit well below this, while quantitative and finance-facing analysts sit above it.
Common Analyst Resume Mistakes
These appear on most analyst applications and each one costs a screen the candidate should have passed:
- Using the bare title with no type or domain, leaving a hiring manager to guess whether you analyse financial data, operational processes or customer behaviour.
- Listing reports and dashboards produced with nothing about what changed, which describes activity rather than value and reads identically to every other application.
- Claiming SQL without indicating depth, when interviewers test it directly and the difference between basic and advanced becomes obvious almost immediately.
- Omitting the data cleaning and reconciliation work, which is most of the job and the part that best demonstrates real analytical experience.
- Presenting tools as achievements, so the resume reads as a software inventory rather than as evidence of thinking applied to a business problem.
- Leaving out the audience for your analysis, when who you presented to and how senior they were says a great deal about the level you have worked at.
Analyst Resume FAQs
The questions analysts most often search when applying, answered directly:
Name your analyst type and domain in the title, then lead with two or three decisions that changed because of your work. Follow with your technical stack, the scale of data you handled, and who you presented findings to, since seniority of audience signals the level you have operated at.
Lead with SQL, advanced Excel and a visualisation tool such as Power BI or Tableau, then add data cleaning, modelling and forecasting. Include stakeholder presentation explicitly, because analysis that never persuaded anyone is the most common way this job fails.
Use the one the advert uses, and make your bullets carry the real scope. Business analysts work on requirements and process, data analysts on datasets and reporting, financial analysts on forecasting and performance. The titles overlap heavily and are applied inconsistently between companies.
Attribute honestly and state the chain. Something like identifying a route running below break-even, which led to it being restructured, credits your analysis without claiming you made the call. Overclaiming ownership of decisions is easily exposed at interview.
Describe capability rather than a level. Write multi-table joins, window functions and query optimisation on large datasets, or Excel including Power Query and array formulas. Words like advanced mean nothing consistent, whereas naming the techniques is directly verifiable.
Build one real analysis end to end on a public dataset, including the cleaning and a written recommendation, and treat it as a project entry. Pair it with a Power BI or SQL certification, and pull out any analytical work from previous roles even if the title was not analyst.
Get Started With Our
Free Resume Creator today!
Free sign-up. No credit card required.